Bias auditing is often discussed as an ethical obligation and is just as usefully framed as an engineering one: it is how you find out that your model will fail on part of your traffic before your users do.
Start by describing, not judging
The first step is simply to know what is in the dataset, which is a surprising amount of the work and requires no ethical framework at all.
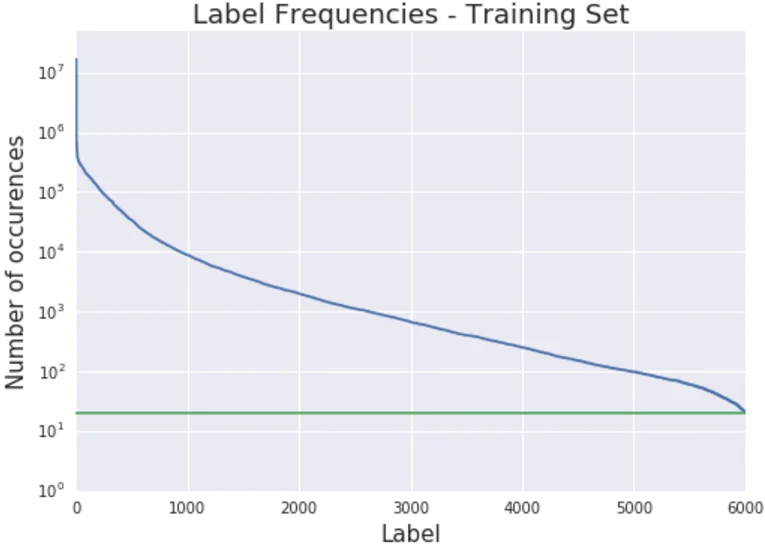
Count the distribution of every attribute you can observe or infer: class labels, source, language, length, date, geography, image resolution and capture conditions, and any demographic attribute that is actually recorded. Plot them. A great deal of what people call bias is visible immediately as a lopsided histogram.
Two cautions. Do not infer sensitive attributes that are not recorded — inferring ethnicity from names or gender from faces introduces errors and its own harms, and an audit that does it is making things up. Where an attribute is not recorded, say that it is not recorded; an honest gap is a finding. And remember that absence is as informative as imbalance: a category with zero examples will not appear in a distribution plot at all, which is why you should enumerate what you expected to see as well as what you found.
Compare against deployment, not against uniformity
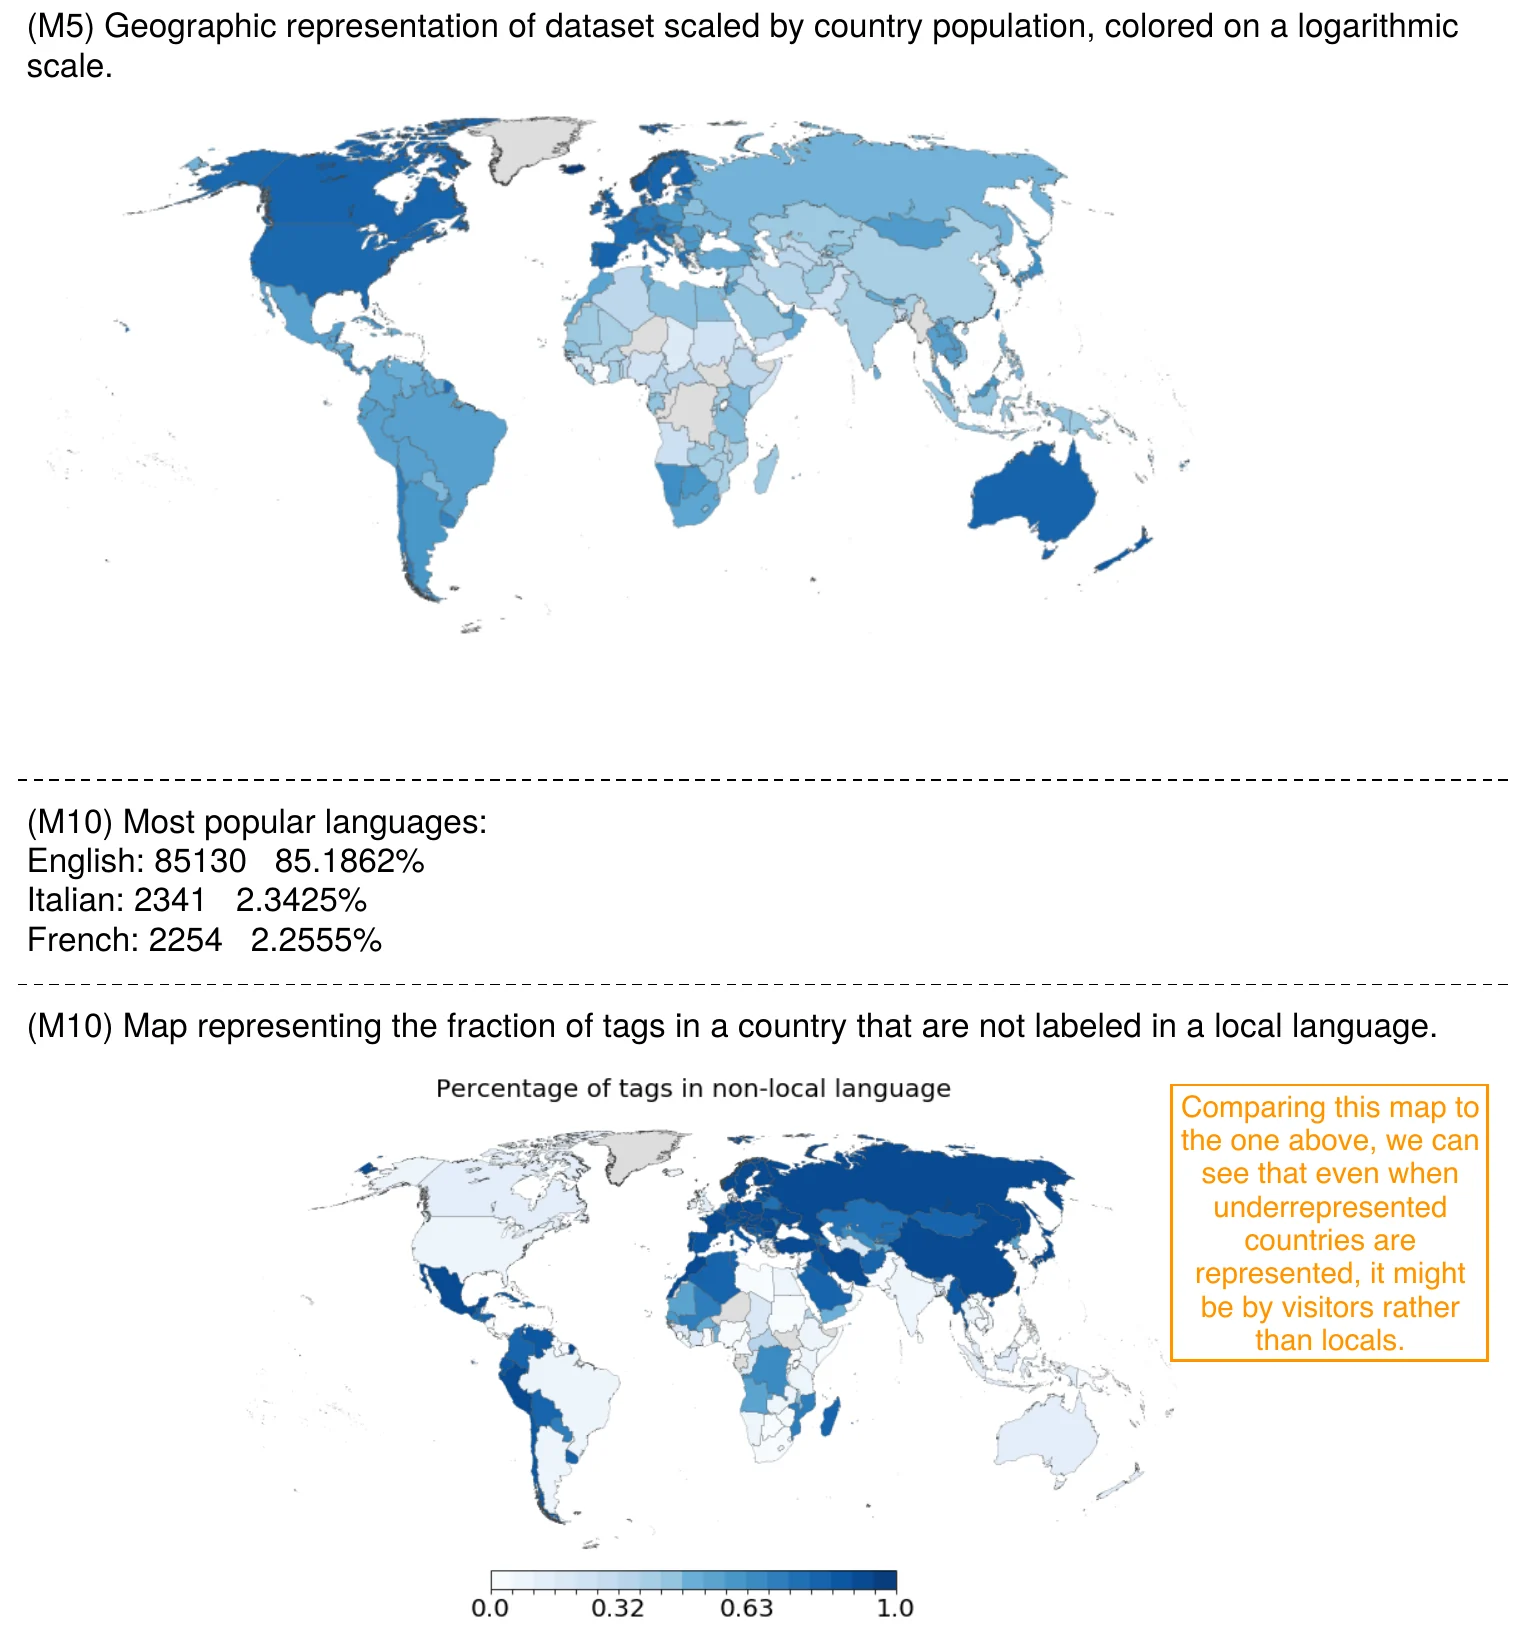
This is where many audits go wrong. A balanced dataset is not automatically the right dataset; the question is whether the training distribution matches the distribution you will serve, and whether performance is acceptable across the parts that matter.
If your users are 80% one language, a corpus that is 80% that language is representative rather than biased. If your users are evenly split and your corpus is 95% one language, that is a gap with a predictable consequence.
So you need two distributions: the training data's, and your deployment population's. The second is harder to obtain and more important. If you do not know who your users are, that is the finding, and it precedes any dataset work.
Where the two legitimately differ and you cannot fix the data, the honest response is to document the limitation and measure performance on the under-represented part specifically rather than reporting an aggregate that hides it.
Test performance by subgroup
Composition predicts problems; subgroup evaluation confirms them. This is the step that turns an audit into something actionable.
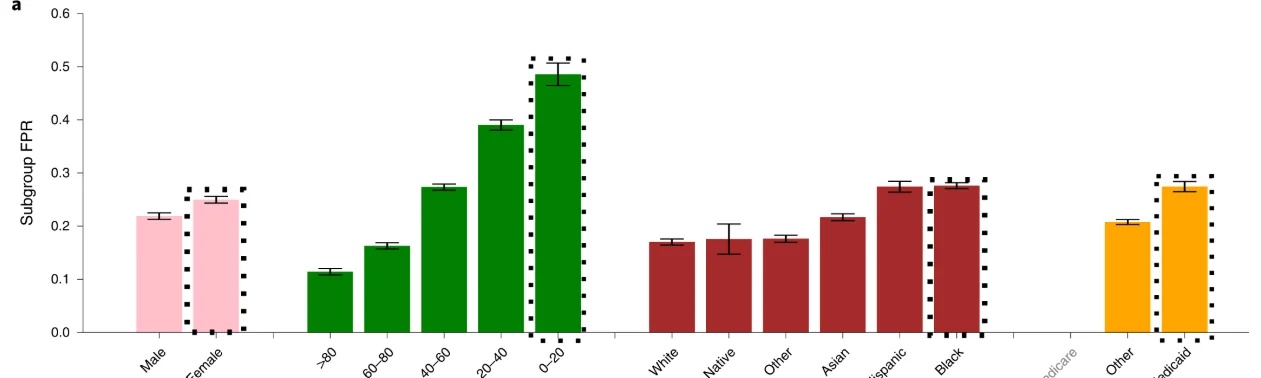
Break your evaluation metric down by every attribute you recorded, and look for the gaps. Aggregate accuracy is an average over your users, and an average can be excellent while a subgroup is badly served — which is exactly the failure that reaches you as a complaint rather than as a metric.
This requires an evaluation set with enough examples per subgroup to be meaningful, which is a design requirement for that set rather than something you discover you have. Our golden eval set guide covers building it; the relevant point here is to over-sample the groups you are worried about, deliberately, so the measurement is possible.
Also test the intersections where you can. Performance can be acceptable on each attribute separately and poor on a combination, and reporting only single-attribute breakdowns misses it.
import pandas as pd

ev = pd.read_json("eval_results.jsonl", lines=True)

print("overall:", ev.correct.mean().round(3), f"(n={len(ev)})")

for attr in ["language", "source", "length_band", "recorded_group"]:
    if attr not in ev:                 # not recorded is a finding, not a zero
        print(f"\n{attr}: NOT RECORDED"); continue
    g = ev.groupby(attr).agg(acc=("correct", "mean"), n=("correct", "size"))
    g["note"] = ["too small to measure" if n < 30 else "" for n in g.n]   # keep it, flag it
    print(f"\n{attr}:\n{g.sort_values('acc').round(3)}")

# and at least one intersection
if {"language", "length_band"} <= set(ev):
    print(ev.groupby(["language", "length_band"]).correct.agg(["mean", "size"]).round(3))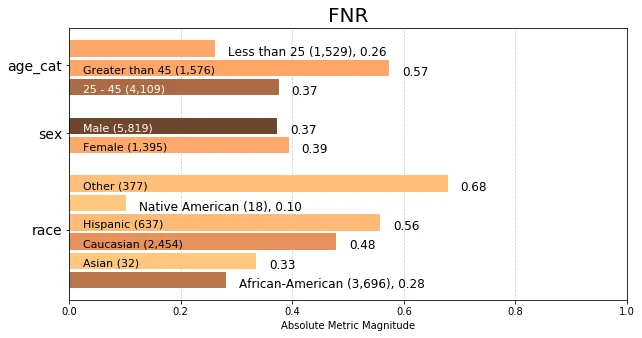
Which gaps data can fix
Not every finding has a data remedy, and knowing which is which saves wasted collection.
Fixable by collecting more. A genuinely under-represented group that exists in your domain and can be sampled. Collect or commission more, and re-measure.
Fixable by reweighting or resampling. Present but swamped. Cheaper than collection, and worth trying first.
Fixable by relabelling. The labels themselves encode the bias, usually via an underspecified annotation guideline. This is more common than people expect and the remedy is to fix the guideline and relabel a sample, not to add data.
Not fixable with data. The world the data describes is itself unequal, and the model accurately reflects it. Historical hiring or lending data is the standard example. More data makes the model a better predictor of a biased process. The remedies here are about the system around the model — what it is used for, what constraints apply, what review exists — rather than the dataset, and pretending otherwise is the most common way these audits produce nothing.
Write it down and re-run it
An audit is only useful if it is repeatable, because datasets and deployments both change.
Write the composition analysis and the subgroup breakdown as scripts, not as a one-off notebook. Run them when the dataset changes and when you retrain. Record the results with the dataset's provenance entry — see our provenance post — so a later question about why the model behaves a certain way has a documented answer.
And publish the limitations you found in your model card. A documented known gap is a professional position; the same gap undocumented is one someone else discovers for you.
Questions people ask
What if sensitive attributes are not recorded?
Then you cannot measure performance by them directly, and you should say so rather than inferring them. Proxies introduce their own errors and harms. You can still audit by recorded attributes that correlate with what you care about — language, geography, source — and report the limitation honestly.
Is a balanced dataset always better?
No. The target is a match to your deployment distribution plus acceptable performance on every subgroup that matters. Artificially balancing a naturally skewed distribution can hurt overall performance while improving a metric nobody is served by.
How many examples per subgroup do I need to measure?
Enough that the estimate is not noise — a few dozen is a reasonable floor for a rough signal, more for a confident one. Below that, report the count alongside the number so the reader can discount it, or say the group is too small to measure.
Can synthetic data fill a representation gap?
Sometimes for the input distribution, rarely for the outcomes. Generating more examples of an under-represented group using a model that under-represents them reproduces the gap in a new form. Our synthetic data post covers where generation helps; this is one of the weaker cases.