Two annotators labelled the same items. Did they agree because the guidelines are clear, or because most items are easy and some agreement happens by chance? Cohen’s kappa answers that. Enter the counts or paste the two columns of labels above; the calculator gives kappa, weighted kappa for ordered labels, a confidence interval, Krippendorff’s alpha and PABAK for comparison, the pair of labels the annotators confuse most, and how many items you need to double-label for a precise number.
How to use the calculator
You need the labels two annotators gave to the same items, labelled independently. A pilot of 50 to 100 items is enough to start.
- Enter the labels. Either fill in the agreement table, where each cell counts the items annotator A put in the row’s label and annotator B in the column’s, or switch to Paste two columns and paste an export from your annotation tool or spreadsheet, one item per line.
- Choose the weighting. Leave it on None for categories with no order (cat, dog, bird). Pick Quadratic for ordered scales such as a severity score, so a 4 rated as a 5 counts as a near miss.
- Read the result. Kappa comes with its 95% confidence interval and two interpretation scales. The notes below it say why kappa might be low: a dominant label, annotators who use the labels at different rates, or too few items. Shaded cells in the table are the disagreements.
- Act on it. Fix the definitions of the most-confused pair, re-run the pilot, then copy the summary into your QA report, or copy a link that reopens the same numbers for a colleague.
What Cohen’s kappa measures
Raw agreement overstates how well two annotators align. If 90% of items are negative and both annotators say “negative” most of the time, they will agree often without reading the guidelines closely. Kappa, introduced by Jacob Cohen in 1960, corrects for that: it compares the agreement you observed with the agreement you would expect if each annotator labelled at random with their own label frequencies.
A kappa of 1 is perfect agreement, 0 is no better than chance, and a negative value is worse than chance, which usually means a systematic misunderstanding such as two labels swapped.
kappa = (p_o - p_e) / (1 - p_e)

p_o = share of items both annotators labelled the same
p_e = sum over labels of (share A gave it) x (share B gave it)How to read the number
The most quoted scale comes from Landis and Koch (1977), who presented their bands as arbitrary but useful benchmarks. McHugh (2012) argued that the same cut-offs, which she attributes to Cohen, are too lenient for health research, where a kappa of 0.41 would count as moderate, and proposed a stricter scale on which anything below 0.60 indicates inadequate agreement. The calculator shows both.
| Kappa | Landis & Koch | McHugh |
|---|---|---|
| below 0 | Poor | — |
| 0.00–0.20 | Slight | None |
| 0.21–0.40 | Fair | Minimal (0.21–0.39) |
| 0.41–0.60 | Moderate | Weak (0.40–0.59) |
| 0.61–0.80 | Substantial | Moderate (0.60–0.79) |
| 0.81–1.00 | Almost perfect | Strong (0.80–0.90), almost perfect above 0.90 |
Weighted kappa for ordered labels
Plain kappa treats every disagreement as equally wrong. That is right for nominal labels such as cat, dog and bird, but not for ordered ones such as a severity score from 1 to 5, where rating a 4 as a 5 is a near miss and rating it a 1 is not. Weighted kappa (Cohen, 1968) gives partial credit for near misses.
With linear weights, partial credit falls in equal steps with the distance between categories. With quadratic weights the penalty grows with the square of the distance, so near misses count almost as agreement and distant disagreements are penalised steeply. Quadratic weighting is the usual choice for rating scales. Either only makes sense when the order of the categories is meaningful, which is why the calculator lets you set it.
Why kappa can be low when agreement is high
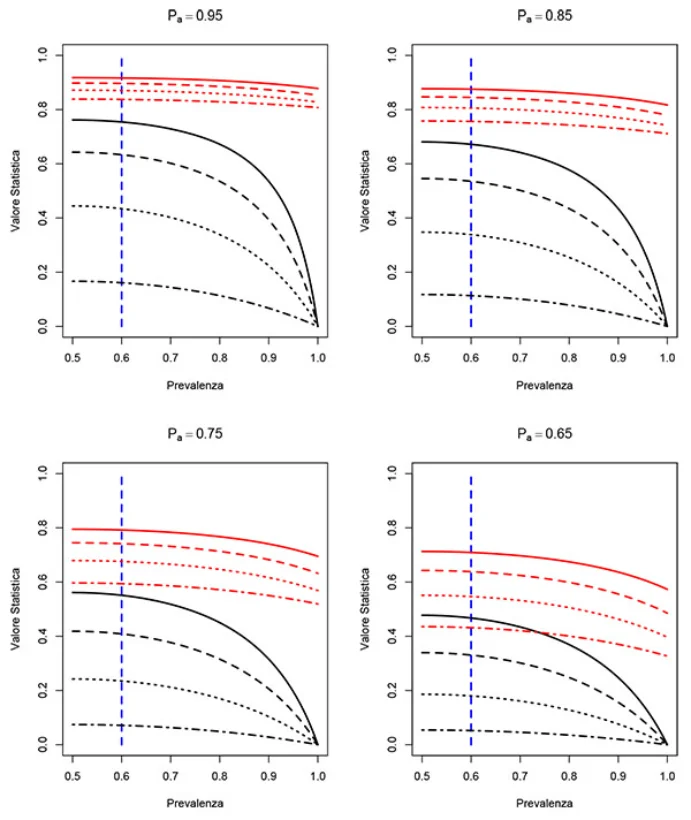
If one label dominates, chance agreement is already high, so even a few disagreements pull kappa down. Two annotators who agree on 95% of items can score a kappa under 0.5 when 95% of the items are negative. This is the first of the two paradoxes described by Feinstein and Cicchetti (1990).
It is not a bug in kappa: the agreement on the rare label really is weak, and that label is often the one your model needs to learn. Report per-label agreement alongside kappa, which the calculator does, and consider sampling more of the rare class for the agreement check.
Two further numbers help separate the causes. PABAK, the prevalence-adjusted bias-adjusted kappa proposed by Byrt, Bishop and Carlin (1993), is what kappa would be if every label were equally common and both annotators used them at the same rate; in the calculator’s rare-defect example it is 0.89 against a kappa of 0.39. The maximum kappa is the highest value the two annotators’ label rates allow: when it is well below 1, one annotator uses a label more often than the other, which usually means they read a threshold differently. Report PABAK next to kappa, never instead of it.
How many items to double-label
Kappa from a small sample is imprecise. In the calculator’s example, 100 items give a kappa of 0.70 with a 95% confidence interval of about 0.58 to 0.82, using the large-sample standard error from Fleiss, Cohen and Everitt (1969). Four times as many items halve the width of that interval. The calculator turns that into a number: for the same example it suggests about 560 items to report kappa within ±0.05, if agreement stays the same.
As a rule of thumb, double-label at least 50 to 100 items in a pilot to find the definitions that need work, and a few hundred spread across the full run if you need a number to report. Make sure the sample includes enough of each label, not just the common ones.
More than two annotators
Cohen’s kappa compares exactly two annotators. With a team, you can report the average of kappa over every pair of annotators, or use Fleiss’ kappa when each item is labelled by the same number of people, or Krippendorff’s alpha when some items have missing labels or the number of annotators varies. All three answer the same question; pick one and report it consistently between batches.
For two annotators the calculator already shows Krippendorff’s alpha next to kappa, so you can check that the two agree before switching. Innovatiana’s guide to inter-annotator agreement covers alpha and the intra-class correlation in more depth, with how agreement checks fit into an annotation workflow.
| Your situation | Statistic | Why |
|---|---|---|
| Two annotators, unordered labels | Cohen’s kappa | Corrects raw agreement for chance |
| Two annotators, ordered scale | Weighted kappa (quadratic) | Near misses get partial credit |
| Three or more, same number per item | Fleiss’ kappa | Generalises kappa to many raters |
| Missing labels or a varying team | Krippendorff’s alpha | Handles gaps and any number of coders |
| Continuous scores | Intra-class correlation | Built for numeric ratings |
| One label dominates | Kappa plus per-label agreement and PABAK | Separates prevalence from real disagreement |
from sklearn.metrics import cohen_kappa_score

a = ["pos", "neu", "neg", "pos", "neg"]
b = ["pos", "neg", "neg", "pos", "neg"]

cohen_kappa_score(a, b)
# ordered labels: pass the order explicitly
cohen_kappa_score(a, b, labels=["neg", "neu", "pos"], weights="quadratic")
When agreement is low, fix the guidelines
Low kappa is rarely about careless annotators. It usually points at two labels whose boundary the guidelines leave open. The calculator names the most-confused pair: rewrite those two definitions, add the disputed items as examples, and run the pilot again. Our annotation guidelines generator structures exactly that, with include and exclude fields for every label.
If you would rather not run the loop yourself, custom requests in Dataset Finder are labelled by trained annotators under a dedicated manager, with a calibration round, sampling reviews, inter-annotator agreement and gold-standard checks built into the work.
Questions people ask
What is a good Cohen’s kappa for annotation?
For training data, 0.8 or above is a common target before a production run. Between 0.6 and 0.8 the guidelines usually need another pass, and below 0.6 the labels are too inconsistent to train on without fixing the definitions first.
What is the difference between kappa and percent agreement?
Percent agreement counts how often the annotators matched. Kappa subtracts the agreement you would expect by chance given how often each annotator used each label, so it is lower. It still depends on how common each label is, so report per-label agreement too.
When should I use weighted kappa?
Only when the categories are ordered, such as ratings or severity levels. Linear weights give partial credit in equal steps; quadratic weights count near misses as almost-agreement, penalise distant disagreements steeply, and are the usual choice for rating scales.
Can kappa be negative?
Yes. A negative kappa means the annotators agreed less than chance would predict, which usually signals a systematic problem, such as two labels being swapped or a definition read in opposite ways.
What is PABAK and should I report it?
PABAK is kappa adjusted as if every label were equally common and both annotators used them at the same rate (Byrt, Bishop and Carlin, 1993). It shows how much of a low kappa comes from a dominant label rather than real disagreement. Report it next to kappa and per-label agreement, not instead of them: the rare label is often the one your model most needs.
Is Krippendorff’s alpha better than Cohen’s kappa?
For two annotators with no missing labels the two are almost identical, as the calculator shows side by side. Alpha earns its place with three or more annotators, missing labels or a changing team, because it handles all of those in one statistic.
Does the calculator match scikit-learn?
Yes. Kappa and weighted kappa match sklearn.metrics.cohen_kappa_score, alpha matches the krippendorff Python package (nominal, and interval with quadratic weights), and the standard error matches the asymptotic one in statsmodels. The calculation runs in your browser and nothing is uploaded.