Annotation quality control is a measurement problem: you check a sample, count errors and decide whether the batch is good enough. The size of the sample decides how much that decision is worth. Two errors in 100 checked items is consistent with a true error rate anywhere from under 1% to 7%.
Quality is an estimate, so it has an error bar
Every quality figure on a labelling project is a sample statistic. A reviewer checks some items, finds some errors and reports a rate. That rate estimates the error rate of the whole batch, and its precision depends on how many items were checked, not on what share of the batch they were.
This is where percentage rules go wrong. “Review 10% of every batch” means 50 items on a batch of 500 and 5,000 on a batch of 50,000. The first is too few to tell a 2% batch from a 6% one; the second spends far more review time than the decision needs. Fix the number of items checked, and let the percentage fall where it falls.
The arithmetic is the binomial distribution. With k errors in n randomly drawn items, the observed rate is k/n and a confidence interval gives the range of true rates consistent with it. For proportions near zero, which is where annotation error rates sit, Brown, Cai and DasGupta (2001) recommend the Wilson interval over the textbook normal approximation, which misbehaves at small counts. The table holds the observed rate at 2% and changes only the sample size.
| Items checked | Errors found | Observed rate | 95% interval (Wilson) |
|---|---|---|---|
| 50 | 1 | 2% | 0.4% to 10.5% |
| 100 | 2 | 2% | 0.6% to 7.0% |
| 200 | 4 | 2% | 0.8% to 5.0% |
| 500 | 10 | 2% | 1.1% to 3.6% |
| 1,000 | 20 | 2% | 1.3% to 3.1% |
Acceptance tests for batches
Gold items measure people. Acceptance sampling measures deliverables: before a batch is accepted, draw a random sample of n items, review them, and accept the batch if the number of errors is at or below an agreed acceptance number c.
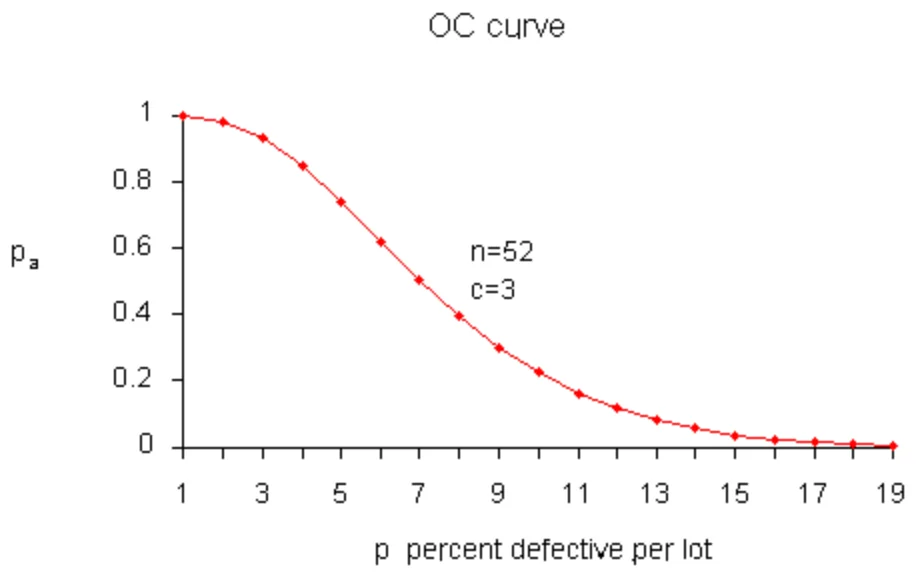
The method comes from manufacturing. According to the NIST/SEMATECH e-Handbook, US MIL-STD-105D was issued in 1963, adopted as ANSI Z1.4 in 1971 and, with minor changes, as ISO 2859 in 1974. ISO 2859-1 tabulates plans by lot size, inspection level and acceptable quality level (AQL). The standard is not open, but the calculation behind any plan is binomial and fits in a spreadsheet cell: the probability of accepting a batch with true error rate p is the probability of seeing c or fewer errors in n draws. Plotted against p, that is the plan’s operating characteristic (OC) curve, which the same handbook works through for a 52-item plan.
Agree in advance what a rejection triggers. The sampled errors get fixed, and the rest of the batch goes back for rework or full review; correcting only the sampled items leaves the error rate of every other item where it was.
The table gives the acceptance probability for four plans whose acceptance numbers sit between 2% and 2.5% of the sample.
| Plan (n, c) | True rate 1% | True rate 2% | True rate 5% | True rate 10% |
|---|---|---|---|---|
| 50 items, accept if ≤ 1 error | 91% | 74% | 28% | 3% |
| 80 items, ≤ 2 errors | 95% | 78% | 23% | 1% |
| 125 items, ≤ 3 errors | 96% | 76% | 12% | under 1% |
| 200 items, ≤ 5 errors | 98% | 79% | 6% | under 1% |
Consensus, expert review and what each catches
Consensus means several annotators label the same item independently and their agreement is the evidence. It catches independent slips: a misclick, a missed object, a moment of inattention, since two people rarely make the same slip on the same item. It cannot catch errors the whole team shares. Three annotators who learnt the same wrong rule agree perfectly. How many labels to buy and how to combine them is the subject of our piece on how many annotators per item.
Expert review means a more senior person checks a sample of finished work. It catches systematic errors, such as a misread class definition or a convention that drifted, provided the reviewer knows the intended rule better than the annotators do. It is weaker on slips, because a reviewer shown an existing label is checking rather than labelling, and a plausible wrong label is easier to accept than to produce. Blind re-annotation of the sample costs more and removes that effect.
| Method | Catches | Misses |
|---|---|---|
| Consensus (2–3 independent labels) | Random slips, inattention | Errors the whole team shares |
| Expert review of a sample | Systematic errors, guideline drift | Slips the reviewer accepts |
| Gold items | Individual accuracy and drift | Item types missing from the gold set |
| Acceptance sample | Batch error rate against a threshold | Which annotator caused it |
What the research says moves quality most
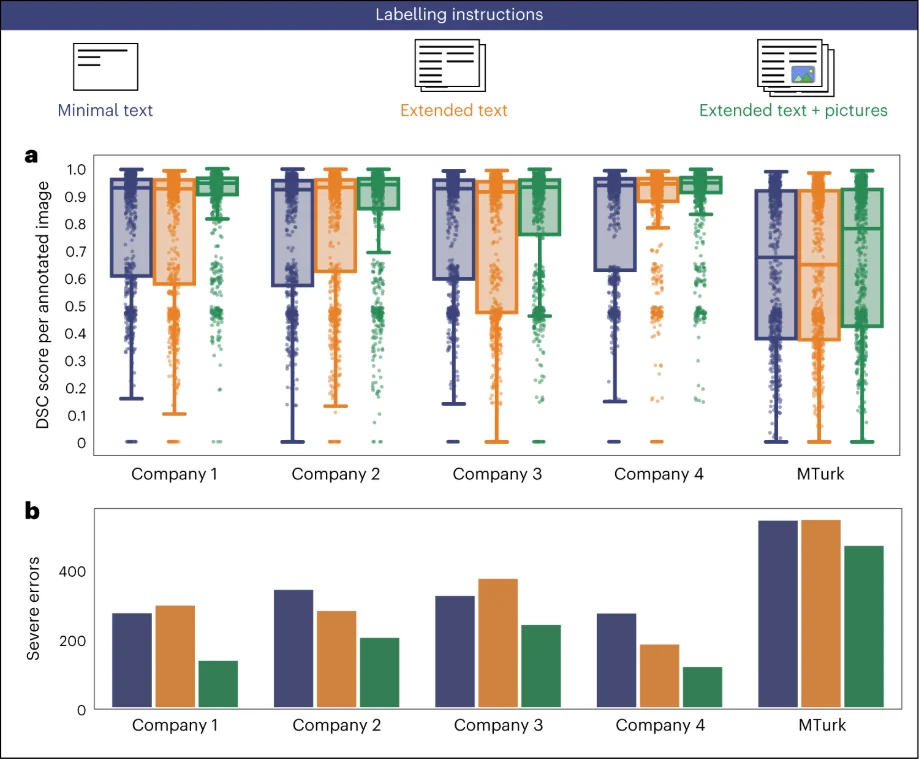
Checking finds errors after they happen. The strongest evidence on preventing them is a study by Rädsch et al. (2023) in Nature Machine Intelligence: 14,040 endoscopic images annotated by 156 annotators from four professional annotation companies and 708 Amazon Mechanical Turk workers, with three versions of the labelling instructions.
Two findings matter for QA planning. Adding example images to the instructions cut severe errors (median −33.9%) and raised the median Dice score by 2.2%, while extending the text alone made no statistically significant difference. And with minimal instructions, the professional companies reached a median Dice score of 0.93 against 0.67 for MTurk; the odds of a severe error for a professional annotator were 0.09 times those of a crowdworker.
The same paper surveyed 363 professional annotators (298 after filtering) who named labelling instructions as the main cause of problems in their work, and found that 76% of the eligible MICCAI competition tasks registered for 2020 and 2021 reported no labelling instructions at all.
The practical reading is that QA budget spent upstream goes further than budget spent on review: pictures of boundary cases in the guidelines, built with something like our annotation guidelines template, and a trained workforce. Review then confirms the result rather than rescuing it. How much the remaining errors cost a model depends on their kind, which our piece on label noise covers.
A QA plan to attach to an order
Written before labelling starts and agreed with whoever does the work, a plan of this shape turns quality from an argument into a measurement.
- Define an error for each label type in writing, with a severity: a wrong class, a box outside a stated overlap tolerance, a missed entity. Without this, error counts are not comparable between reviewers.
- Pilot 50 to 100 double-labelled items, measure agreement, and revise the guidelines until it stops improving.
- Build the gold set from adjudicated pilot items, weighted towards hard cases, and budget 100 to 200 gold answers per annotator over the project.
- Fix the acceptance plan per batch: sample size, acceptance number, and what happens to a rejected batch.
- Set retraining and removal thresholds for individual annotators before any results come in.
- Track drift weekly: gold accuracy per annotator, acceptance results per batch, and a refreshed gold pool.
- Record the results in the dataset card, so the next user of the data knows the measured error rate and how it was measured.
Questions people ask
How do you measure data annotation quality?
Define what counts as an error for each label type, then estimate the error rate from a random sample of finished items checked against the guidelines, with a confidence interval. Track three things: batch error rate from acceptance samples, per-annotator accuracy from hidden gold items, and agreement between annotators on double-labelled items. Agreement alone measures consistency, not correctness: annotators can agree on the same wrong answer.
What is a honeypot task in data labelling?
A honeypot is a gold item: an item with a known correct answer placed in an annotator’s queue without being marked. It measures that annotator’s accuracy and reveals drift over time. It works only if honeypots look like normal work, include hard cases rather than obvious ones, and are refreshed so that annotators cannot memorise them. Check failed honeypots before scoring them; some gold answers are wrong.
What percentage of labels should be reviewed?
Think in items, not percentages. The precision of a quality estimate depends on how many items you check, whatever the batch size. Two hundred items with four errors gives an interval of roughly 0.8% to 5.0%; fifty items with one error gives 0.4% to 10.5%. Pick the sample size that separates an acceptable batch from an unacceptable one. To tell a 1–2% batch from a 5% one, that is roughly 80 to 200 items, whatever the batch size.
What is the difference between consensus and review?
Consensus collects several independent labels for the same item and uses agreement as evidence; it catches random slips but not errors everyone shares. Review has a more senior person check finished work; it catches systematic errors such as a misread definition, but a reviewer shown a plausible wrong label can let it through. A common arrangement is consensus on a subset and expert review on a sample.
What accuracy should annotated data have?
There is no universal figure, and well-known benchmarks fall short of perfection: Northcutt et al. estimate at least 3.3% label errors on average across ten test sets. Set the bar from what the data is for. A test set needs a lower error rate than a training set, and a rare, costly class needs its own target. Then choose a sample size large enough to show the bar is met.