Overhead imagery breaks several assumptions baked into ordinary vision models: objects have no canonical orientation, targets are often a handful of pixels, and half your scene may be cloud.
Start with cloud masking. It is the least interesting task in this list and the one that silently corrupts every downstream measurement if you skip it.
Seven of the nine are labelled with licences that allow commercial use — MIT, CC0, CC BY, Apache 2.0 or the share-alike CC BY-SA — though two of those labels need checking against their sources: SkyView reuses images from AID and NWPU-RESISC45, and the Wildfire set’s CC BY covers the fire records, not the Mapbox imagery. The exceptions are DOTA, which is for academic use only, and 38-Cloud, whose repository carries an Apache 2.0 licence file but says nothing about the data itself.
| Dataset | Modality | Size | Licence | Best for |
|---|---|---|---|---|
| EuroSAT | Image | 27,000 patches | MIT | Land use |
| 38-Cloud | Image | 17,601 patches | Unclear — see below | Cloud masking |
| DOTA | Image | 2,806 images | Research only | Oriented boxes |
| Ships in Satellite Imagery | Image | 4,000 patches | CC BY-SA 4.0 | Binary screening |
| Ships in Aerial Images | Image | 26,900 annotated images | CC BY-SA 4.0 | Maritime detection |
| SkyView Aerial Landscape | Image | 12,000 images | Unclear — see below | Scene classification |
| PlanesNet | Image | 32,000 chips | CC BY-SA 4.0 | Tiny-object detection |
| Wildfire Prediction | Image | ~42,850 images | Unclear — see below | Risk modelling |
| 4× Satellite Super-Resolution | Image | 720 GeoTIFF pairs | Apache 2.0 | Super-resolution |
EuroSAT
- Size
- 27,000 patches
- Licence
- MIT
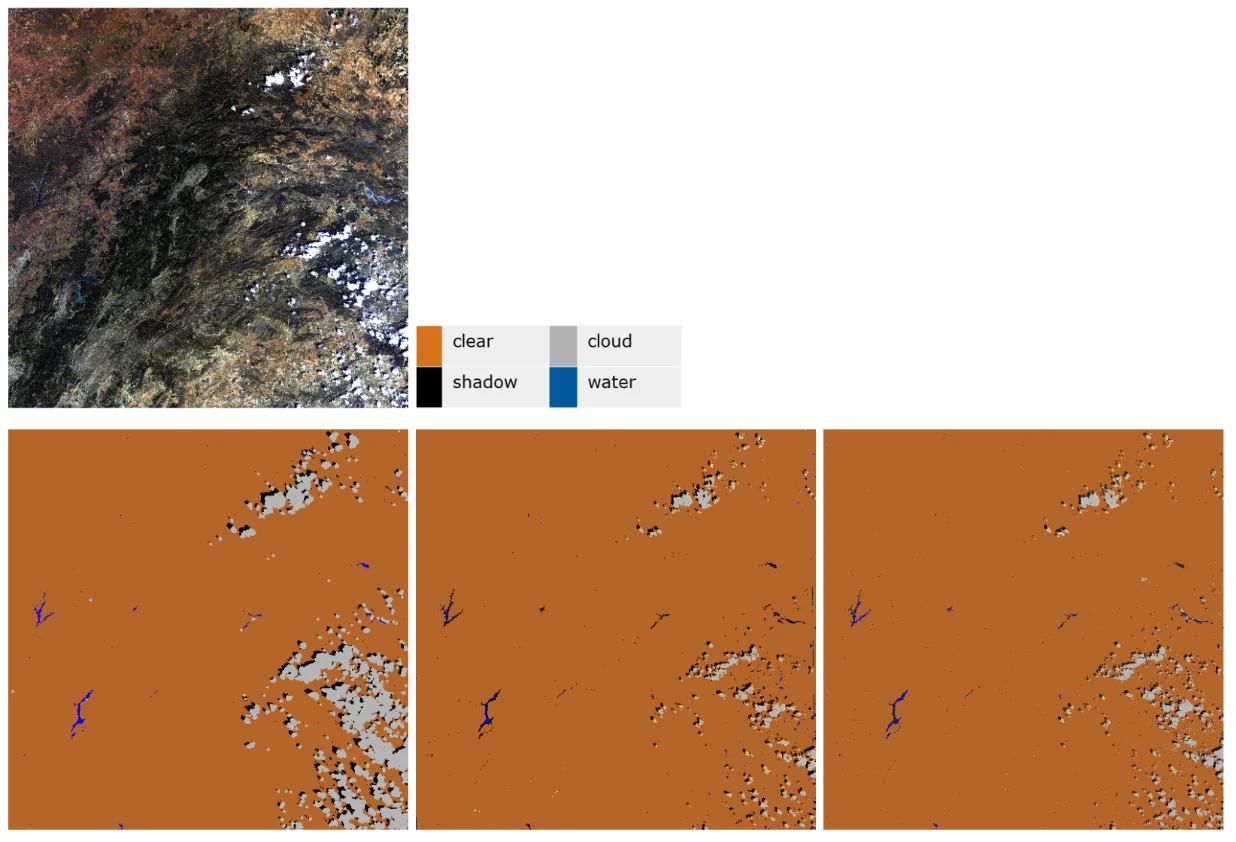
27,000 labelled Sentinel-2 patches at 64×64 pixels across ten classes, each available as an RGB JPEG and as a 13-band multispectral TIFF. The multispectral version is the one that matters — near-infrared bands separate vegetation types that look identical in RGB.
Land-use and land-cover classification, and a clean demonstration of what extra spectral bands buy you.
Source: innovatiana.com/datasets
38-Cloud
- Size
- 17,601 patches (8,400 train, 9,201 test)
- Licence
- Apache 2.0 licence file in the repository; no separate statement about the data
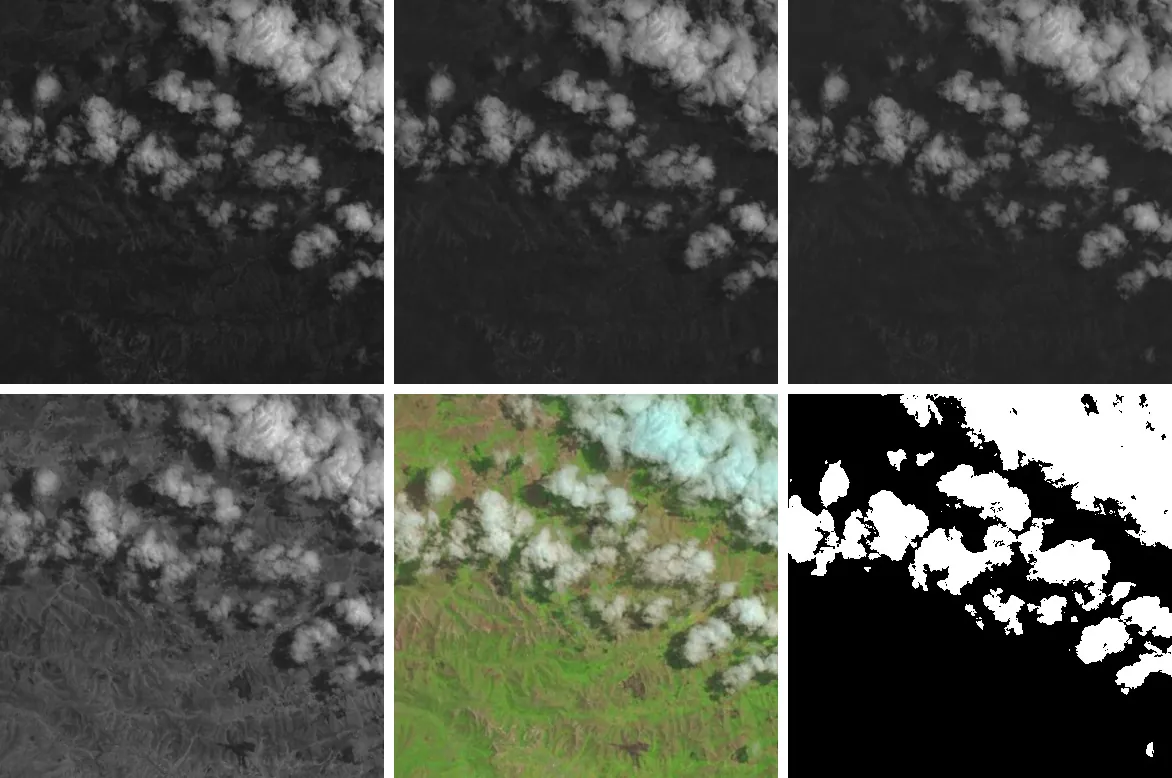
17,601 patches at 384×384 (8,400 training, 9,201 test), each stored as four single-band files — red, green, blue and near-infrared — with cloud masks for the training patches. Cloud masking is the unglamorous first step in every satellite pipeline — get it wrong and every downstream measurement inherits the error.
Cloud segmentation as a pre-processing stage for any optical remote-sensing model.
Source: innovatiana.com/datasets
DOTA
- Size
- 2,806 images · 188,282 objects (v1.0)
- Licence
- Research licence
2,806 aerial images with 188,282 annotated objects in DOTA-v1.0 (403,318 in v1.5; v2.0 extends this to 11,268 images and about 1.79 million objects). Its contribution is oriented bounding boxes: from above, a ship or a runway has no canonical up, and axis-aligned boxes waste most of their area on background.
Oriented object detection in aerial imagery — a different head and loss from standard detectors.
Source: innovatiana.com/datasets
Ships in Satellite Imagery
- Size
- 4,000 patches
- Licence
- CC BY-SA 4.0
4,000 RGB PNGs at 80×80 pixels labelled simply ship or not-ship. Tiny tiles and a binary label, which makes it ideal as the fast first-pass filter in front of a heavier detector.
Patch-level screening to cut the search space before running full detection.
Source: innovatiana.com/datasets
Ships in Aerial Images
- Size
- 26,900 annotated images
- Licence
- CC BY-SA 4.0
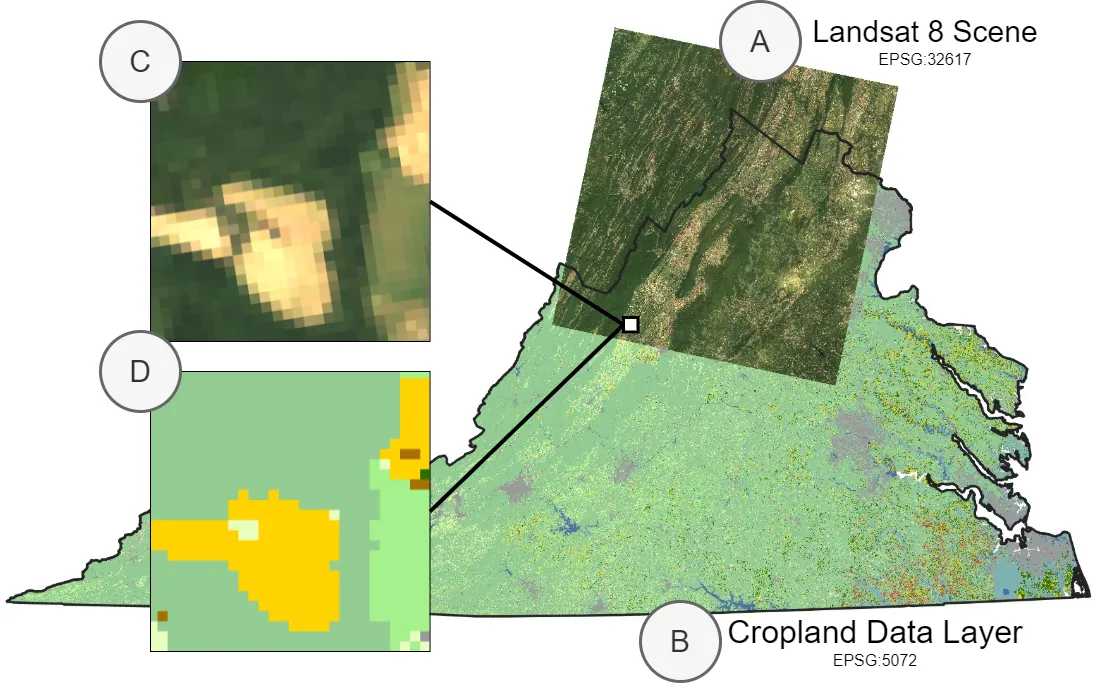
26,900 annotated images with bounding boxes already in YOLO format. Substantially larger than the patch dataset above and annotated for localisation rather than presence, so the two pair naturally in one pipeline.
Maritime vessel detection and port monitoring.
Source: innovatiana.com/datasets
SkyView Aerial Landscape
- Size
- 12,000 images
- Licence
- CC0 1.0 (uploader; images from AID and NWPU-RESISC45)
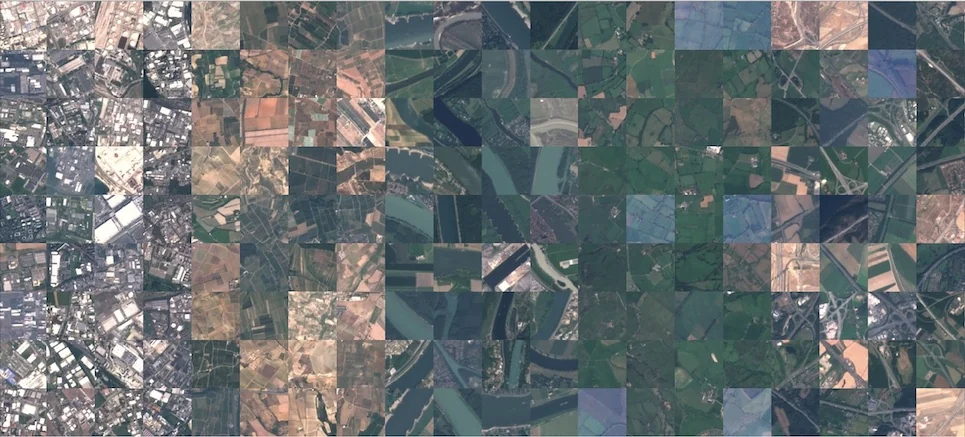
12,000 images at 256×256 covering aerial landscape categories. Uniform resolution and a clean class structure, but the images come from the AID and NWPU-RESISC45 datasets, so the CC0 tag is only as good as those sources' own terms.
Aerial scene classification and backbone pre-training for remote-sensing tasks.
Source: innovatiana.com/datasets
PlanesNet
- Size
- 32,000 chips
- Licence
- CC BY-SA 4.0
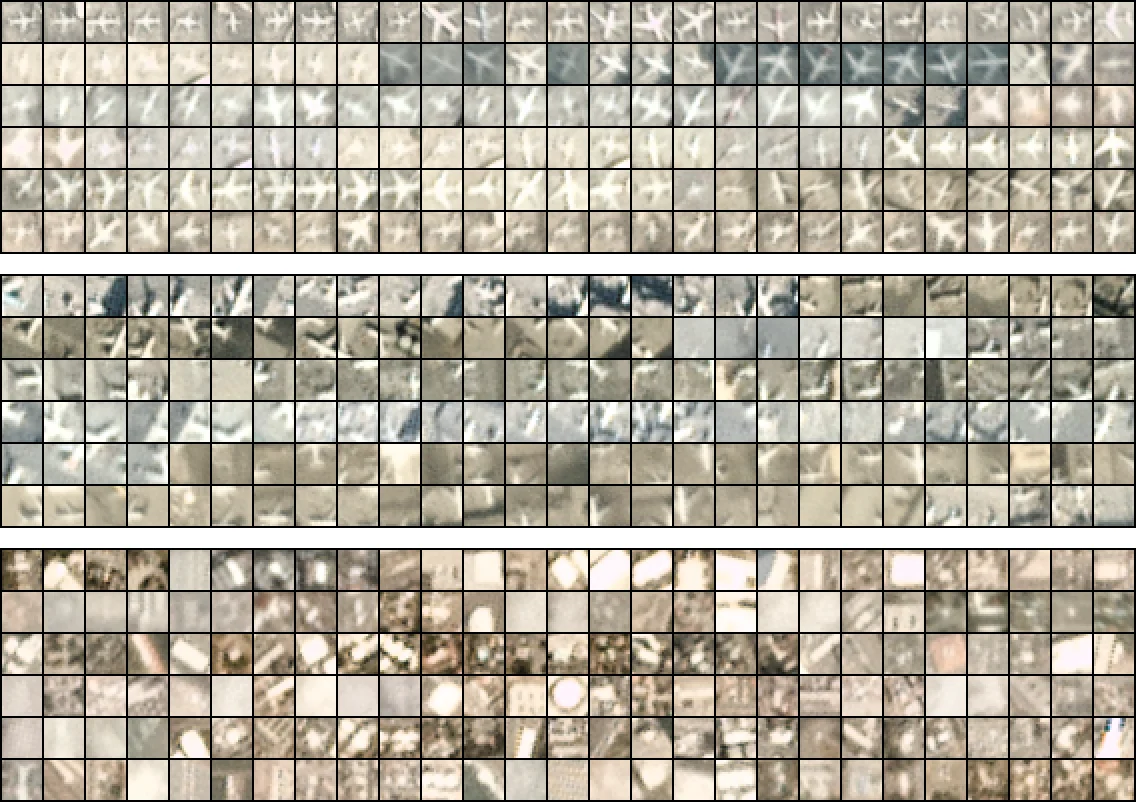
32,000 PNG chips at 20×20 pixels, also distributed as JSON. At that size an aircraft is a handful of pixels, which is exactly the regime where standard detector anchors stop working.
Tiny-object detection, and testing how far you can shrink an input before a classifier fails.
Source: innovatiana.com/datasets
Wildfire Prediction
- Size
- ~42,850 images
- Licence
- CC BY 4.0 (fire records; imagery from Mapbox)
Around 42,850 satellite images at 350×350 pixels for wildfire prediction. The positives are areas of Canada that had previously burned, so the label records where fire has occurred, not the conditions before ignition.
Wildfire risk classification from satellite imagery. CC BY 4.0 is the licence of the Canadian open-government wildfire records; the images come from the Mapbox API, and the uploader states no licence for them.
Source: innovatiana.com/datasets
4× Satellite Super-Resolution
- Size
- 720 GeoTIFF pairs
- Licence
- Apache 2.0
720 paired GeoTIFFs at 2 m and 0.5 m per pixel. Presented as paired low- and high-resolution captures, aligned pixel to pixel, but the uploader does not say whether the 2 m images were captured separately or downsampled from the 0.5 m ones, so test on real low-resolution input before relying on the model.
Satellite super-resolution at a 4× scale factor, from 2 m to 0.5 m per pixel.
Source: innovatiana.com/datasets
How this list was put together
All nine appear in Innovatiana's open-dataset catalogue with published licence and size strings; each links to its source.
Resolutions and patch sizes are quoted as published. Where a dataset offers both RGB and multispectral versions, both are noted in the description.