A LiDAR label is a 3D cuboid or a per-point class, tied to a coordinate frame, a heading convention and, in sequences, a track ID. The major driving datasets define each of these differently, and those definitions, more than the drawing itself, are what break models trained or evaluated across them.
Shapes in 3D, and what they cost
The standard object label is an upright cuboid. The Waymo Open Dataset describes its boxes as 7-DOF: centre (cx, cy, cz), length, width, height and a heading angle θ, with no pitch or roll. The nuScenes schema stores the same idea differently: a centre, a size given as width, length, height, and an orientation quaternion. Same object, different parameterisation, and the difference has to be handled by whoever converts between them.
Point-wise segmentation is far more expensive. SemanticKITTI labelled every point of the KITTI odometry sequences in 28 classes: over 1,400 hours of labelling plus 10 to 60 minutes of verification and correction per tile, more than 1,700 hours in total. A 100 m by 100 m tile took about 4.5 hours in residential areas, the most complex scenery, and about 1.5 hours on highways. The team made it tractable by registering the scans with SLAM and labelling all scans that overlap a location together, rather than scan by scan.
Polylines for lanes, kerbs and map elements form a third family, often drawn on an aggregated map rather than per sweep. They are outside the scope of the object protocols compared below.
Tooling changes the cuboid cost substantially. LATTE, an open-source labelling tool, combined sensor fusion, one-click annotation and tracking, and its authors report a 6.2× faster annotation speed, with 23.6% higher instance-level precision, 2.2% higher recall and 2.0% higher box IoU than labels made without those features.
What the major protocols specify
The published protocols of four widely used datasets agree on the shape and disagree on almost everything around it. The table summarises what each paper or official page states.
| Field | KITTI | nuScenes | Waymo Open | Argoverse 2 |
|---|---|---|---|---|
| Label rate | single frames (7,481 train) | 2 Hz keyframes | 10 Hz | 10 Hz |
| Box frame | camera coordinates | global frame | vehicle frame | not stated in paper text |
| Which objects | visible in the image | 1+ lidar or radar point | zero-point excluded; 5 or fewer = LEVEL_2 | within 5 m of drivable area |
| Track IDs | separate tracking benchmark | instance per scene | unique per sequence | consistent over time |
| Detection match | 3D IoU 0.7 car, 0.5 others | centre distance 0.5–4 m | IoU 0.7 vehicle, 0.5 pedestrian | see its evaluation docs |
Conventions that differ: heading, box fit, sparse objects, keyframes
Axes and heading. The MMDetection3D coordinate-system notes summarise the trap. In camera coordinates x points right, y down and z forward; in LiDAR coordinates x points forward, y left and z up. KITTI’s raw labels are in camera coordinates and are converted for LiDAR models. Relative to the earlier SECOND code base, MMDetection3D made the yaw right-handed instead of left-handed and changed box dimensions from (w, l, h) to (l, w, h), while the nuScenes devkit’s box class puts width before length, as SECOND did. Each is a sign flip or axis swap that a converter can get wrong without any error: the boxes load, rotated by 90 degrees or mirrored.
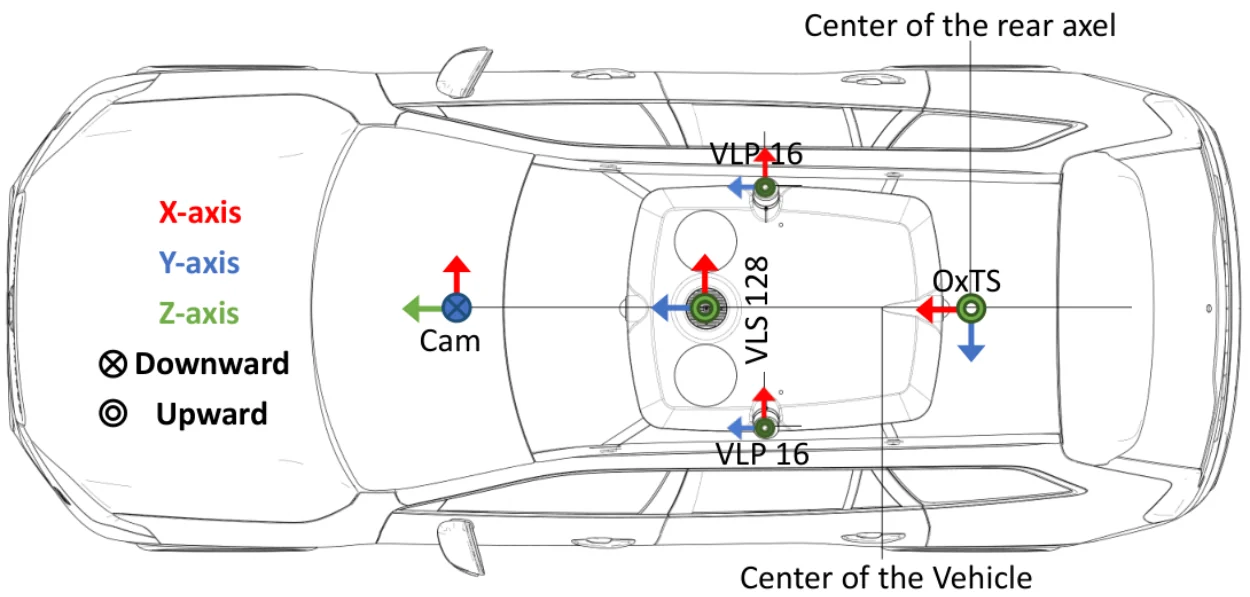
Which way is the front. nuScenes evaluates orientation over 360 degrees for every class except barriers, which are scored over 180 degrees, and ignores orientation for traffic cones. A labelling spec therefore needs a list of classes that have a front and a definition of the front for each, such as the direction of travel or the cab end of a lorry.
Sparse objects. nuScenes annotates an object for as long as at least one lidar or radar point falls on it, then removes ground-truth boxes with no points at evaluation, along with boxes beyond class-specific ranges of 30, 40 or 50 m. Waymo’s evaluation excludes zero-point objects and moves those with five points or fewer to LEVEL_2. KITTI labels only objects that also appear in the image. A model trained on one and scored on another is credited or penalised for objects that were never labelled the same way.
Box statistics. Wang et al. (CVPR 2020) traced most of the accuracy lost when moving 3D detectors between datasets to differences in car sizes: KITTI has the smallest boxes and Waymo the largest, and most boxes tightly contain their points, so the gap is in the objects, not loose labelling. A PointRCNN detector trained on KITTI reached 11.9% AP3D on Waymo (easy setting) against 85.3% when trained on Waymo; rescaling the training boxes to the target’s mean size raised it to 53.3%, and few-shot fine-tuning on labelled target scenes to 70.9%. Compare box-size distributions per class before pooling data.
Box fit. None of these papers states in its main text whether cuboids enclose the full extent of a partly occluded object or only its visible points. Your spec has to decide, because it moves box centres and sizes for every occluded object.
Keyframes. nuScenes labels 2 Hz keyframes in 20-second scenes; Waymo and Argoverse 2 label at 10 Hz. A tracker or velocity head trained on 2 Hz labels with 20 Hz sweeps has no ground truth for the sweeps in between.
Tracking IDs and interpolation across sweeps
All three sequence datasets carry identity. Waymo gives every object a unique identifier that is consistent across each sequence, Argoverse 2 cuboids carry track identifiers consistent over time, and nuScenes links each annotation to an instance with previous and next pointers. nuScenes instances are not tracked across scenes, so the same parked car in two scenes is two instances.
Rigid vehicles make 3D interpolation easier than 2D: the box size should stay constant along a track, and only position and heading change. A good spec says so, and a good QC script checks it, flagging any track whose length or width varies beyond a tolerance. Pedestrians are the exception, since their extent changes with gait.
Interpolate in a world frame rather than the sensor frame. The sensor moves with the vehicle, so a parked car interpolated in vehicle coordinates appears to drive. nuScenes avoids the issue by storing all locations in a global frame. The identity rules for occlusion and re-entry are the same as in camera video, and our video annotation article covers them with the metrics that catch ID switches.
Camera-LiDAR fusion, auto-annotation and the human part
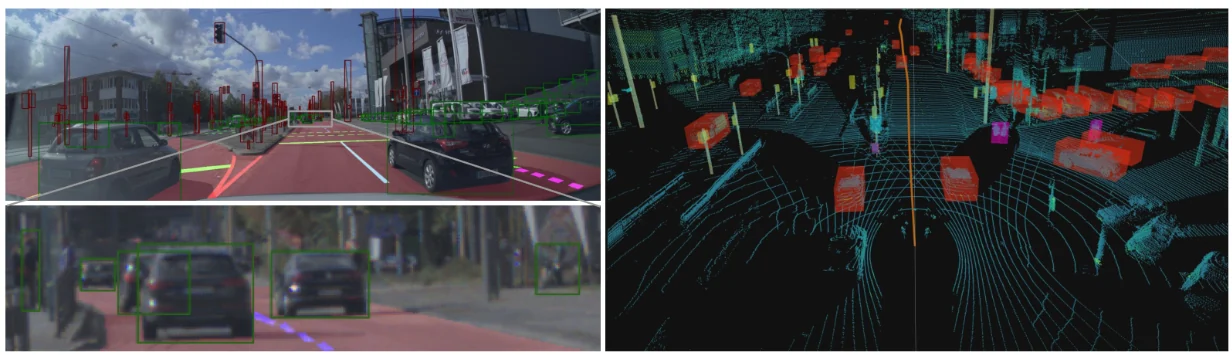
LiDAR gives geometry; cameras give class and attributes. A distant pedestrian may be a handful of points, while the image shows clearly what it is. That is why the protocols lean on cameras: KITTI labels only what the image shows, nuScenes records visibility as the fraction of each annotation visible across all six cameras (binned 0–40%, 40–60%, 60–80% and 80–100%), and Waymo adds tight 2D camera boxes alongside the 3D boxes and their amodal 2D projections.
The basic fusion check is projection. Draw every cuboid into every camera that sees it; an outline that sits beside its object points to a calibration or timestamp problem, and one that sits on the wrong object points to a class or ID error. It is cheap to automate and catches errors that are hard to see in the point cloud alone.
Auto-annotation uses the same projection in reverse. The AutoExpert benchmark (Ma, Hua and Kong) asks a system to produce 3D boxes from an annotation guideline with a few labelled images and text descriptions per class. Its pipeline detects and segments objects in RGB images, lifts them into 3D with the known sensor poses, and fits cuboids. On its nuScenes-based benchmark, refinements raised mAP from 12.1 to 25.4. That is a large relative gain and still leaves much of the work, and all of the verification, to people.
Model-proposed cuboids change the human job from drawing to correcting. The corrections that matter most are the ones the conventions above make expensive: heading on symmetric objects, extent under occlusion, and the decision to keep or drop sparse objects.
Writing a LiDAR labelling spec
A spec that settles the conventions before labelling starts is cheaper than any converter written afterwards. Our annotation guidelines template covers the general structure. Illustrate it with your own sensor data: the AutoExpert authors did not use the official nuScenes guideline images, because they come from outside the dataset and were likely sourced from the internet, with possible copyright issues. They picked 4 to 8 training images per class instead. Examples from your own data also show the people labelling exactly what your sensor produces. For LiDAR, these are the items that must be explicit:
- Frame and units: the coordinate frame of delivered boxes, axis directions, the zero and sign of yaw, and the order of dimensions, with one worked example box.
- Box fit: full extent or visible points only, for occluded and truncated objects.
- Minimum evidence: the least number of points for an object to be labelled, and what to do with objects visible in a camera but with no points.
- Range and region: the distance limit and any region of interest, per class if needed.
- Heading: which classes have a front, and how the front is defined.
- Rate and interpolation: the keyframe rate, whether intermediate sweeps are interpolated, and in which frame.
- Identity: rules for occlusion, re-entry and objects that split or merge, such as a lorry and trailer.
- Acceptance: the metric and threshold, IoU or centre distance, and a projection check into the cameras.
Questions people ask
How do you annotate LiDAR data?
Usually by fitting upright 3D cuboids to objects in each annotated sweep, with a class, a heading and, in sequences, a track ID, while checking camera images for class and visibility. Tools interpolate boxes between keyframes and propagate a fixed box size along a track. For semantic tasks, every point is classed instead, which SemanticKITTI did on registered, aggregated scans rather than one sweep at a time.
What is a 3D cuboid annotation?
A box in 3D space described by a centre, three dimensions and a rotation. Driving datasets use upright boxes with heading only: Waymo describes them as 7-DOF (centre, length, width, height, heading), while nuScenes stores width, length, height and a quaternion. The parameters are equivalent, but the axis order, frame and heading sign differ between datasets and must be converted carefully.
What is sensor fusion annotation?
Labelling with LiDAR and camera data together, so that geometry comes from the point cloud and class, attributes and visibility come from the images. Cuboids are projected into each camera to check fit. The LATTE tool used sensor fusion with one-click annotation and tracking and reported a 6.2× speed-up with higher label precision and recall.
How long does it take to annotate a LiDAR frame?
The papers compared here do not publish a per-frame time for cuboids, which depends on object density, range and tooling. For point-wise labels, SemanticKITTI reports about 4.5 hours per 100 m by 100 m tile in residential areas and 1.5 hours on highways, over 1,700 hours in total. Assisted tools change cuboid times by multiples: LATTE reports 6.2×.
How are objects tracked across LiDAR frames?
Each physical object receives one ID for the whole sequence: Waymo’s identifiers are consistent across each sequence, and nuScenes links annotations of an instance with previous and next pointers. Annotators label keyframes, the tool interpolates, ideally in a world frame, and reviewers check for ID switches and for box sizes that drift along a rigid object’s track.