Tabular data is the most common format in real organisations and the one where the deep learning revolution has been least decisive.
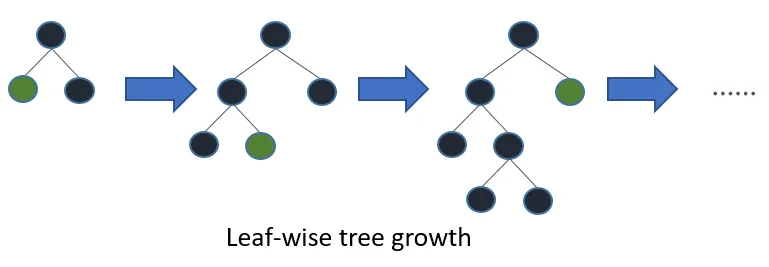
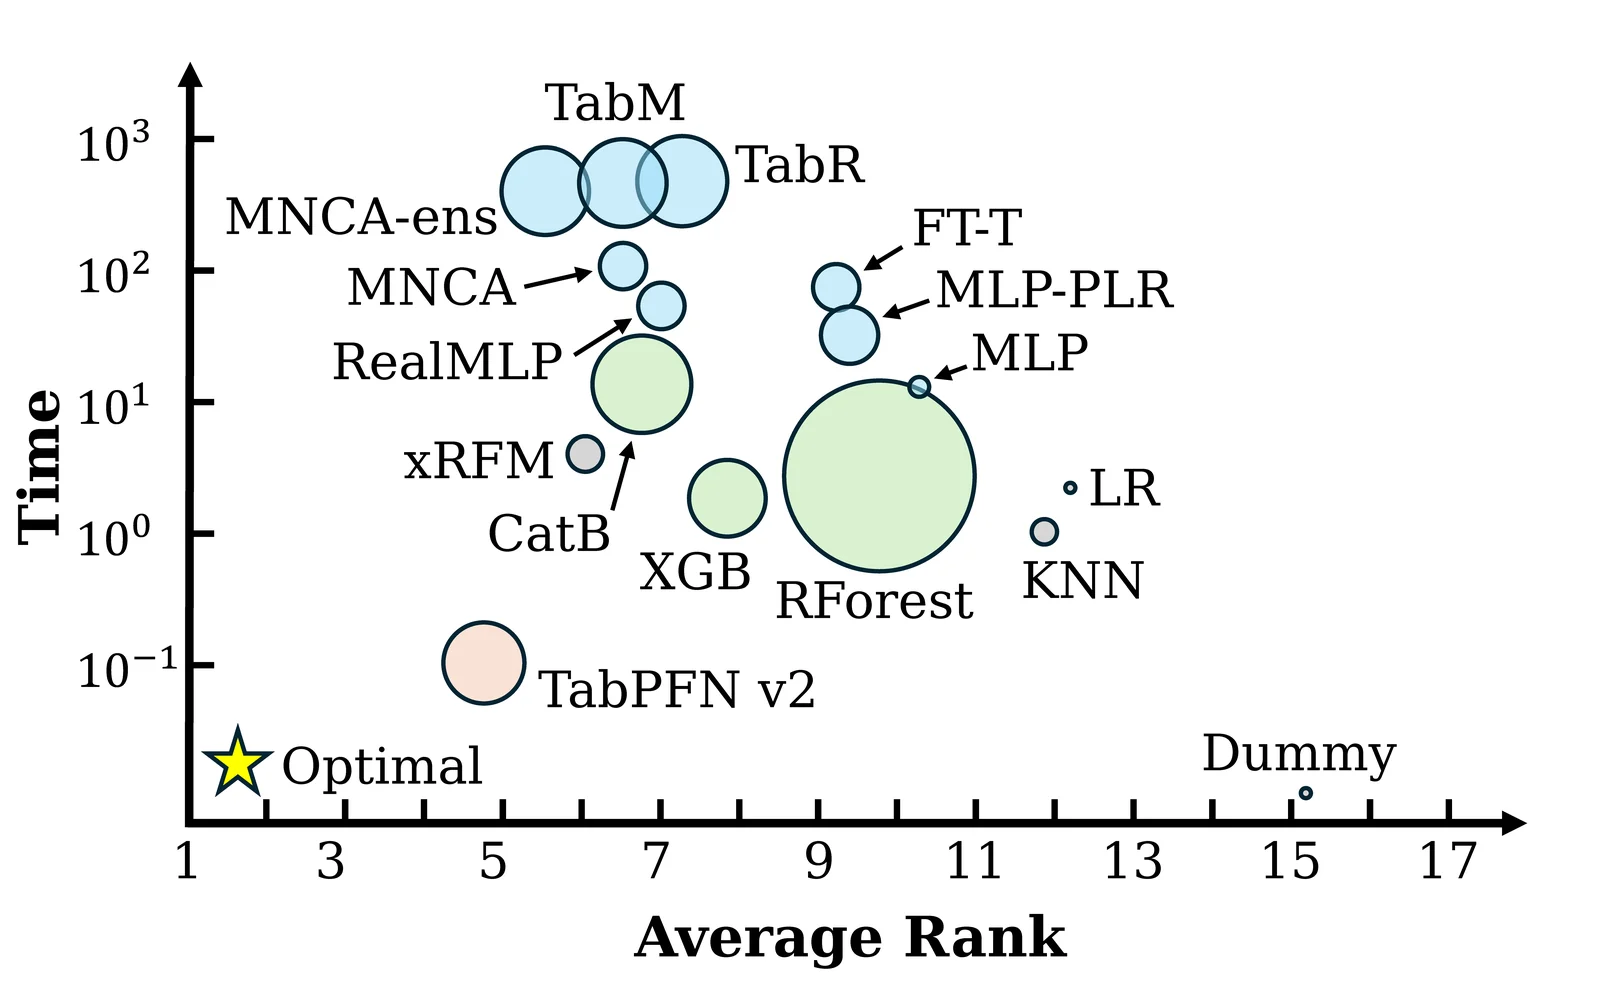
It is worth knowing before you plan a project that gradient-boosted trees remain highly competitive with neural networks on tabular problems and remain the baseline to beat, though pretrained models such as TabPFN now lead on small tables. That has two practical consequences: your baseline should be a boosted tree model, and you likely need far less data than a deep learning framing would imply.
The work in tabular machine learning is mostly feature engineering and data quality rather than architecture. Missing values, categorical encoding, outliers, inconsistent units, and the leakage risk from features that would not be available at prediction time — these determine results far more than model choice. The leakage risk is the serious one: a feature computed after the outcome it predicts will produce an excellent score and a useless model.
| Dataset | Modality | Size | Licence | Best for |
|---|---|---|---|---|
| Telco Customer Churn with Realistic Customer Feedback | Text | 13 MB files | CC BY 4.0 | Classification and sentiment analysis models |
| Deep Sea Corals & Sponges | Tabular | 500,000 observations | CC0 | Mapping and modelling deep-sea biodiversity |
| IIT Admissions Dataset | Tabular | 200,000 records | CC0 | Admissions trends and academic preferences |
| Bank Marketing | Tabular | 4 files | CC BY 4.0 | Supervised classification models |
| UCI Machine Learning Repository | Tabular | Several hundred datasets | CC BY 4.0 | Experimenting and testing machine learning models |
| Details of 11,000 Drugs | Tabular | 11,000 rows | Unclear — see below | Search engines or AI assistants |
| Netflix Movies and TV Shows 2021 | Tabular | 5,897 rows | Unclear — see below | Recommendation systems |
| Phishing URLs | Tabular | 96,018 URLs in CSV format | Unclear — see below | Classification models to detect fraudulent URLs |
| 40k Songs with Audio Features and Lyrics | Multimodal | 43,000 songs | Apache 2.0 | Musical analysis and classification |
Telco Customer Churn with Realistic Customer Feedback
- Size
- Approximately 13 MB, 4 CSV and PKL files, 76 columns, textual and tabular data
- Licence
- CC BY 4.0
About 13 MB across four CSV and PKL files with 76 columns, pairing classic telecom customer records with GPT-3.5-generated written feedback. The synthetic text turns a standard tabular churn set into a mixed-modality one.
Training classification and sentiment analysis models, developing churn prediction that combines tabular and text data, and testing NLP with realistic synthetic data.
Source: innovatiana.com
Deep Sea Corals & Sponges
- Size
- Over 500,000 observations, CSV files, structured tabular formats
- Licence
- CC0: Public Domain
Over 500,000 NOAA observations of deep-sea corals and sponges below 50 metres, in structured CSV, with taxonomy, location, depth, sampling method and source. Tabular records, not imagery.
Mapping and modelling deep-sea biodiversity, predicting where corals and sponges occur from depth, location and habitat, and supporting deep-sea conservation policy.
Source: innovatiana.com
IIT Admissions Dataset
- Size
- Approximately 200,000 CSV tabular records with academic, financial, and demographic fields
- Licence
- CC0: Public Domain
Roughly 200,000 tabular CSV records on students who applied to the Indian Institutes of Technology, with academic, financial and demographic fields covering field of study, specialisation, tuition fees and discounts.
Studying admissions trends and academic preferences, analysing financial factors influencing admission, and modelling or predicting admission chances by profile.
Source: innovatiana.com
Bank Marketing
- Size
- 4 CSV files: bank-full with 45,211 rows and 17 columns, and bank-additional-full with 41,188 rows and 20 inputs plus the target
- Licence
- CC BY 4.0 (UCI Machine Learning Repository)
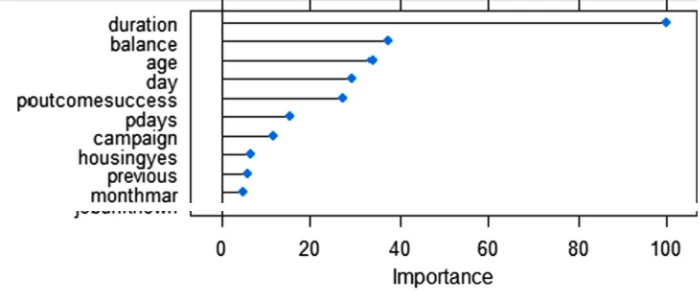
Four CSV files, the largest holding 45,211 rows (a later version has 41,188 rows with 20 inputs including economic context), recording a Portuguese bank's telephone marketing campaigns and whether each customer subscribed to a term deposit. A classic tabular classification benchmark. UCI's original release is CC BY 4.0; the Apache 2.0 tag comes from a Kaggle re-upload.
Training supervised classification models, targeting campaigns at likely subscribers, and studying how socio-demographic factors relate to banking behaviour.
Source: innovatiana.com
UCI Machine Learning Repository
- Size
- Several hundred datasets (689 listed in November 2026), of various sizes, in CSV, ARFF and other formats
- Licence
- CC BY 4.0 under the repository's donation policy (attribution required, commercial use allowed); check each dataset's page, as some older datasets carry their own terms
Several hundred public machine learning datasets of varying sizes in CSV, ARFF and other formats, hosted by the University of California, Irvine. A catalogue rather than a single dataset, with per-dataset terms.
Experimenting and testing machine learning models, validating tabular pipelines, training supervised models on concrete cases, and teaching data science.
Source: innovatiana.com
Details of 11,000 Drugs
- Size
- 11,000 rows in CSV format, structured text drug data
- Licence
- Labelled CC0 by the uploader; text from an online pharmacy platform
Structured CSV data on more than 11,000 drugs, covering names, components, indications and manufacturers. Small and tabular, useful as a knowledge base behind a pharmaceutical assistant rather than as training data. The CC0 tag is the uploader's; the text comes from an online pharmacy platform that never waived its terms.
Creating search engines or AI assistants in pharmaceuticals, analysing common medical trends or components, and feeding health recommendation systems.
Source: innovatiana.com
Netflix Movies and TV Shows 2021
- Size
- 5,897 rows in CSV format, structured columns (title, genre, country, IMDb rating...)
- Licence
- Labelled CC0 by the uploader; catalogue data collected from the Flixable search engine
5,897 CSV rows of structured metadata on films and series available on Netflix in 2021, covering type, country, release date, duration, genres and IMDb rating. Small and tabular. The CC0 tag is the uploader's: the catalogue was collected from the Flixable search engine, so it is not a dedication by the rights holders.
Creating recommendation systems based on ratings or genres, analysing Netflix programming by country or year, and exploring cultural preferences through availability.
Source: innovatiana.com
Phishing URLs
- Size
- 96,018 URLs in CSV format
- Licence
- ODbL as tagged on the Kaggle re-upload; the original PhishStorm release (Aalto University, 2014) states no licence
A balanced set of 96,018 legitimate and phishing URLs in CSV, each labelled 0 or 1 and accompanied by features computed from PhishStorm metrics. Balance plus precomputed features make it drop-in for classifiers.
Training classification models to detect fraudulent URLs, testing real-time web security algorithms, and evaluating machine learning on balanced binary data.
Source: innovatiana.com
40k Songs with Audio Features and Lyrics
- Size
- Around 43,000 songs in English with lyrics files (text) and audio features (CSV/JSON)
- Licence
- Apache 2.0
Around 43,000 English-language tracks spanning 79 genres, pairing song lyrics as text with extracted audio descriptors in CSV and JSON. It ships derived audio features rather than raw audio, but the lyrics are copyrighted text, so commercial use still needs a rights check.
Musical analysis and classification from lyrics and audio characteristics, training multimodal audio-text models, and automatic music or lyric generation.
Source: innovatiana.com
How this list was put together
Found by searching Dataset Finder for datasets whose documentation describes the task, then checked by hand. A keyword match is not a fit — the first pass picked up a coral survey for the depth-estimation list because it was recorded below fifty metres — so every entry was read against what this page covers, and the ones that matched a word without matching the task were removed.
Sizes and licences come from each dataset's own documentation, vague wording included. Where we found a re-upload or catalogue card stating a licence that the original release contradicts — a CC0 tag on Flickr photographs, MIT on data whose terms require a signed agreement — the entry gives the original terms and says so. The comparison table abbreviates licences; hover a cell for the full wording.